Papers are curated using a template implemented as a Google Sheet. Here is an example of a fully filled-out curation sheet for the paper described below.
When multiple rows are entered, columns with identical information can be copied from one row to another to speed data entry. However, one must be very careful to not copy columns that actually have different data between rows. It is best to work methodically through the paper and curate figures or tables sharing methodology between signatures at the same time. Including the methodology column aids in keeping track of related signatures and makes it safer to copy data between rows during curation.
Guidelines on choosing results to curate
- Results must originate directly from human subject tissues, not e.g. cell culture or human subject cells stimulated to alter their phenotype. In vitro assays may be used to quantify results.
- Each result curated should be demonstrated or stated by the authors to be statistically significant.
- Prefer results that have an associated figure or table rather than just call-outs of particular e.g. genes in the results or discussion sections of the paper, although items the authors choose to emphasize may have major value if drawn from significant results.
- Missing correct results is less important than not creating incorrect results (false positives). Be careful and take your time.
- We accept whatever criterion for statistical significance was used by the authors. The curator may add a note in the "comments" field if e.g. unadjusted p-values were used for a large set of genes.
- If the expression results are merely reported in a table and the authors do not specifically use values that have a non-significant adjusted p-value, it is better to filter out these values. The adjusted p-value used to filter raw results can be recorded in the comments.
- Results of most interest include:
- gene expression
- cell-type frequency - how a particular cell type changed in frequency among measured types e.g. in samples of PBMCs after infection.
- cell activation state
- cytokine/protein level
- Not to be curated:
- genes that are reported or called out in the publication because they are members of particular interest in an enriched pathway, but for which no evidence of significant differential expression at the individual gene level is provided, should not be curated separately from their pathway.
Goals of curation
We attempt to capture results as closely as possible to the manner in which they were reported. This is useful for several purposes:
- makes it easier find to a particular curated result in the original publication
- allow reviewers to check any translation of reported results to controlled vocabulary terms (e.g. Cell Ontology, NCBI Taxonomy)
- allow use of standardized methods to update reported gene symbols
For this reason, for several data types, two columns are provided, one for the original, and a second for a controlled vocabulary code.
- tissue_type and tissue_type_term_id
- exposure_material and exposure_material_id
Details of the curation example
Opening details
Overall features of the publication
Details that do not change between signatures can be copied into the first annotation row and copied as needed from there to other rows. This includes the publication_reference_id, publication_date, publication_reference_url, and the submission_date (date the submission was prepared).
Cohort and age fields
In the example publication, Table 1 contains a detailed breakdown of the Hong Kong and Atlanta cohorts by a number of clinical and demographic variables, such as disease state, age, sex, and method. For each signature, the proper cohort and often subset of the cohort must be determined through reference both to the table and descriptions in the text. Doing this correctly requires paying close attention to detail in the paper.
Figure 1
In general we wish to curate each result as closely as possible to how it was presented in the publication. This is illustrated in these first examples, where each panel is reported in a separate row, although the only difference between pairs of panels is the cohort (Atlanta or Hong Kong). A method to save time here was to enter the data for the first cohort, then copy and paste the row to create a new entry for the other cohort. Then only the cohort name needed to be changed. This method can often be applied, but must be done very carefully to not miss any differences between the rows.
The first data rows in the curation sheet (rows 10-17) come from separate panels of Figure 1. Rows 10 to 13 (Figure 1, B and C) are examples of cell-type frequency results, while 14 to 17 (Figure 1, D and E) are protein levels. All show significant results from mass cytometry (phospho-CyTOF). Note that only the total cohort size for the Atlanta plus the Hong Kong samples is given in the text, although the results are reported separately in the figure.
The signature on row 10 shows that the two response components plasmablasts and effector CD8 T cells had a cell-type frequency response behavior of "up" in COVID19 vs healthy patients. The two cell types are separated in the response_components column by a semicolon. The different COVID-19 severity levels have been pooled for the statistical test, and so are reported as "pooled moderate, severe, ICU, and convalescent COVID-19 vs healthy" in the comparison column, and in the disease_stage column they are listed as "moderate, severe, ICU, convalescent (pooled)". Note the extensive marker proteins modifying each cell type, copied exactly as shown in the publication (copy-paste):
- plasmablasts (CD3−, CD20−, CD56−, HLA-DR+, CD14−, CD16−, CD11c−, CD123−, CD19lo, CD27hi, and CD38hi); effector cd8 T cells(CD3+, CD8+, CD38hi, and HLA-DRhi)
Rows 14 to 17 (Figure 1, D-E) report protein-level results for S6 and IkappaBalpha. Note that phospho-CyTOF was used to determine the cell types the protein was measured in.
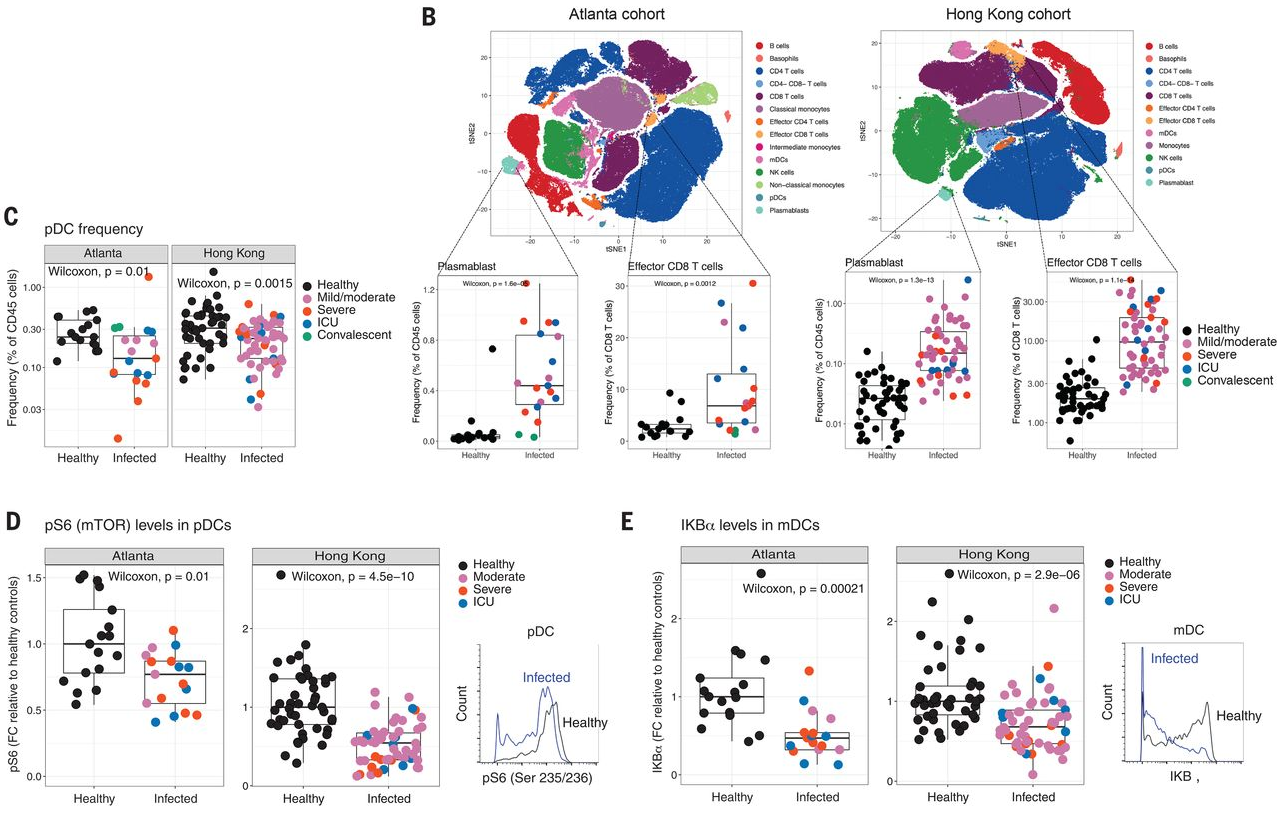
Figure 2
Figure 2 (only final result panels shown) concerns "Flow cytometry analysis of ex vivo stimulated human peripheral blood leukocytes from COVID-19 patients". Panel A shows that IFN-alpha, TNF-alpha and IFN-alpha plus TNF-alpha together are decreased in infected vs healthy cells following stimulation with a viral cocktail. Panel B is similar but for myeloid dendritic cells, and it shows results for no stimulation, stimulation with a bacterial cocktail, and stimulation with a viral cocktail. Each result is reported on a separate row. Panel C shows a fold change of protein fluorescence in bacterial stimulated vs unstimulated case and control samples. The number of subjects (case + controls) is given in the figure legend.
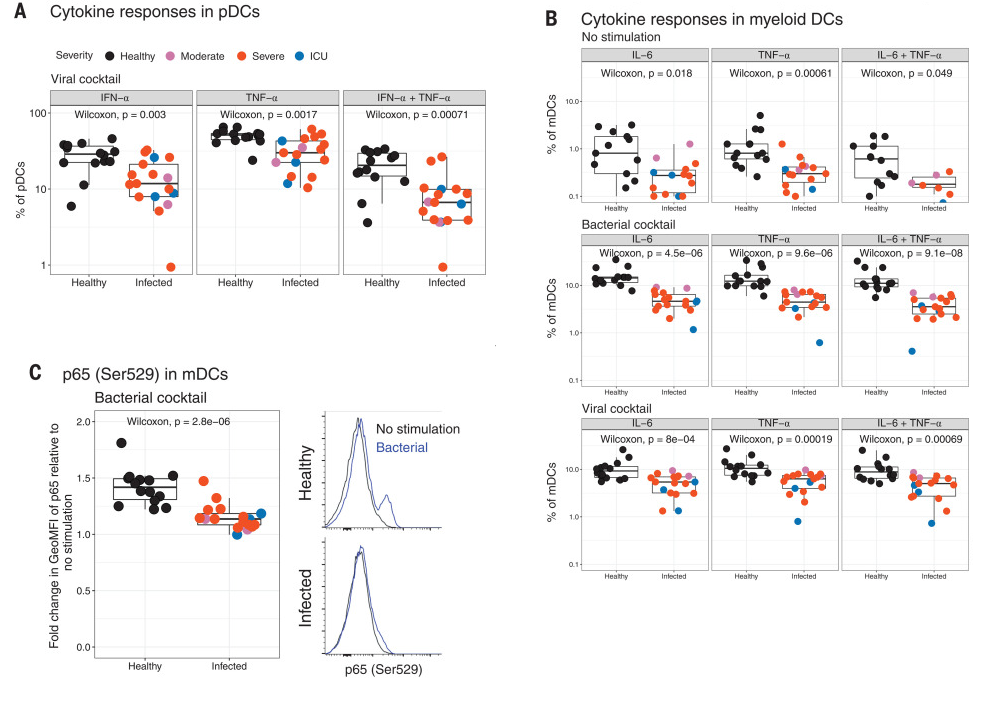
Figure 3
In contrast to the results in Figure 1, in Figure 3, the Olink mulitplex inflammation panel was employed on whole blood (rows 31-37). Protein names are reported as in the manuscript and not converted to gene symbols. TNFSF14, EN-RAGE, OSM were mentioned in the second point of the abstract. For each protein, e.g. IL-6 in row 31, all significant comparisons can be reported in a single row by separating the comparisons with semicolons as follows: moderate COVID-19 vs healthy; ICU vs moderate COVID-19; ICU vs severe COVID-19, as long as they all have the same response direction (response behavior), as is the case here. The data for CXCL10 comes from Supplemental figure S6B (not shown).
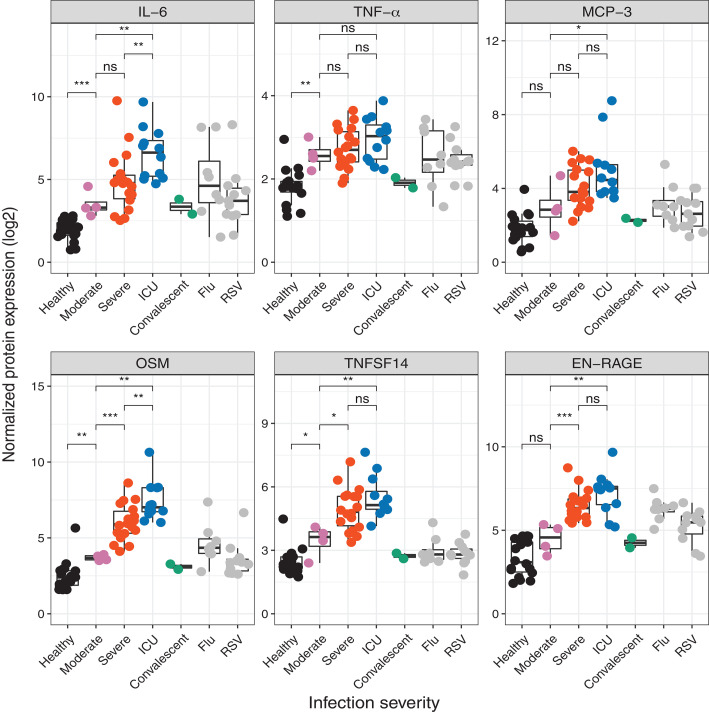
Figure 4
Figure 4 is mostly descriptive, with only Figure 4G definitely related to a significant signature. Figure 4C concerns blood type modules, and is described in the text as "Detailed analysis of the expression pattern of the distinct union of genes driving the enrichment of these antiviral pathways in monocytes and dendritic cells revealed that many ISGs were up-regulated in these cell types". We choose not to curate this result due to the difficultly in summarizing these result (various cell types, results separated for COVID-19 vs health) and because pathway (BTM) results of not currently of primary interest.
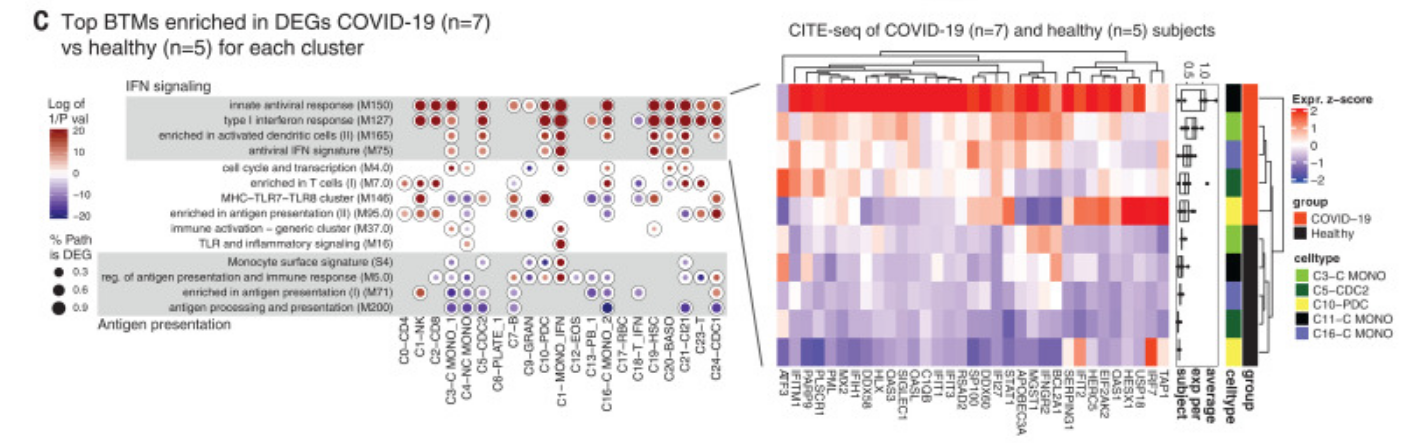
Figure 4G was curated into row 25 of the annotation spreadsheet. It reports the transient "up" expression of interferon-stimulated genes in response to COVID-19, a central claim of the paper. The greatest up-expression is seen in early, day 5 and 10 samples.
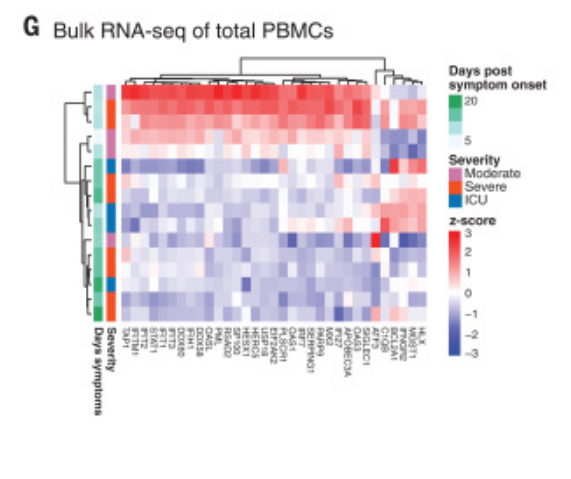
Figure 5
The results in Fig 5A do not shown any claim of significance so they are not curated. Fig 5B quantitates HLA-DR levels in myeloid dendritic cells (mDCs) and classical monocytes using phospho-CyTOF. As before, the results are entered separately for each cohort in rows 39-42.
Figure 5C has 5 graphs, one for each of five genes for bulk RNA-seq of total PBMCs. In the text of the article referencing figure 5C, they say only the results from S100A12 were significant, and it can be seen that only for this result was the response direction "up". Inspection of the five graphs show that S100A12 has the most significant results, with p-values < 0.01 for severe and ICU vs healthy controls. Although there are other individual comparisons that are significant for some of the other genes, we will follow the text and only curate S100A12 (row 43), yielding four significant comparisons.
Figure 5E show the correlation between gene expression and protein levels. This is not a signature specific to COVID-19 and we will not curate it. Figure 5F is similarly not curated.
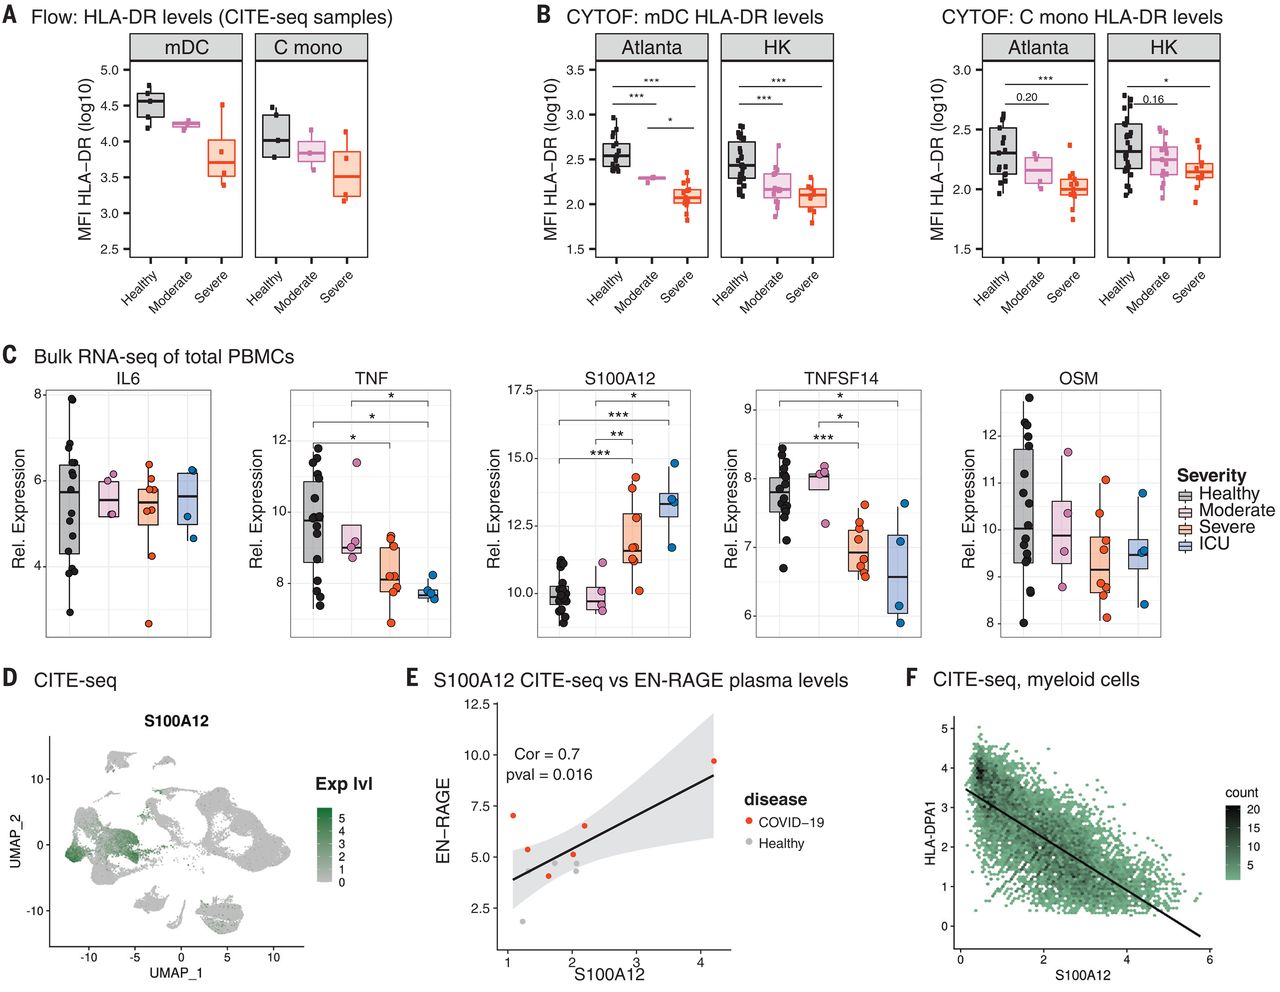
Figure 6
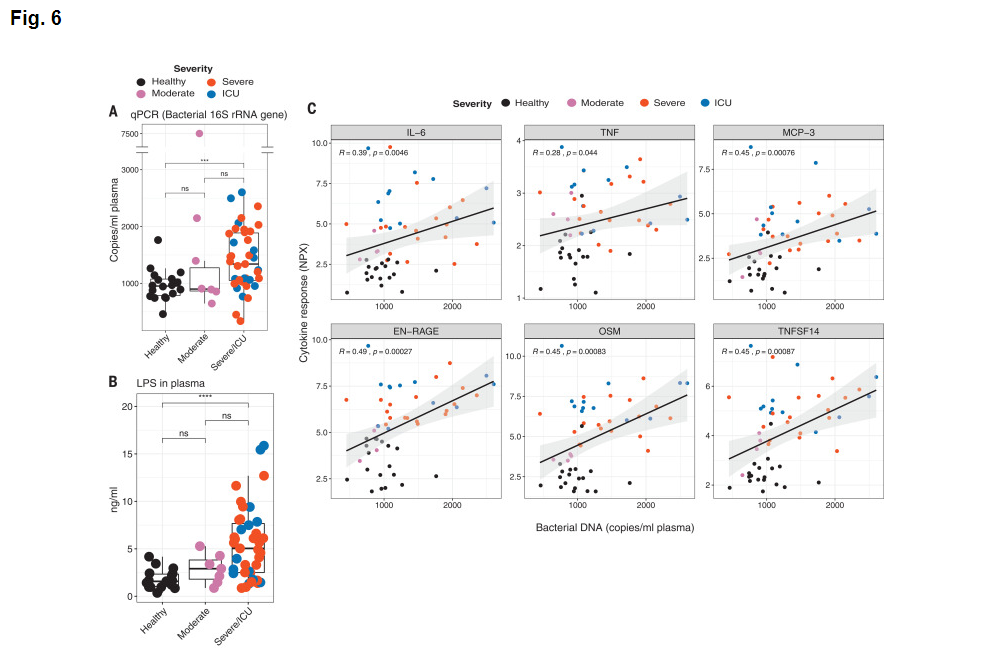
Figures 6A and 6B concern analytes, bacterial 16S rRNA and lippopolysaccharide that are not part of the target response components of this project and are hence not curated.
Figure 6C tests for a correlation of inflammatory cytokine gene expression with the level of bacterial DNA. These results are entered in row 44. The authors suggest that "These results suggest that the enhanced cytokine release may in part be caused by increased bacterial products in the lung or in other tissues".
Supplemental Table S4 - significantly differentially expressed genes by cell type.
Finally, rows 45 to 83 report gene expression changes in a number of different cell types identified and quantitated using CITE-seq. These bulk gene expression signatures were taken from an Excel spreadsheet included among the supplemental materials (Suppl. Table S4). The comparison is described as severe-moderate vs healthy, so we assume that the severe and moderate cases were pooled and report the comparison as "pooled moderate and severe COVID-19 vs healthy". This spreadsheet contained both the uncorrected and the adjusted p-values. Many of the results had adjusted p-values that were not significant. Because the results in this table were included as a quality control step rather than being used to directly draw conclusions, we chose to filter out results that had an adjusted p-value of greater than 0.05. Another tab in the results included only the top 100 genes for each cell type, but we chose to not curate these as they comprise a less complete set of gene signatures. The actual figure that uses the gene expression results to create a heatmap used only 10 genes from each cell type. Two rows of data for which no cell type was determined (CL21) were omitted.
Extracting sets of genes which are all reported together in a spreadsheet can be laborious, as the results may need to be filtered, sorted and copied. In this case, the sheet was first sorted on adjusted p-value, and rows with values greater than 0.05 were removed. The sheet was then sorted first on cell-type and then on fold-change. This allowed the positive and negative sets of genes to be copied to separate rows in the curation sheet for each cell type.